IC Markets Home Sign in Web Trader Contact Us
IC Markets Social IC Markets Social

Information Hub for
Serious Traders

  • ABOUT US
  • OPEN LIVE ACCOUNT
  • OPEN DEMO ACCOUNT
  • TRADE NOW
  • VISIT OUR BLOG
IC Markets Social
  • ABOUT US
  • OPEN LIVE ACCOUNT
  • OPEN DEMO ACCOUNT
  • TRADE NOW
  • VISIT OUR BLOG
June 9, 2021North_American_Stocks_ptIC Markets

Microsoft Corporation Nível visado: 231.2309

Canal ascendente identificado em 08-jun-2021 15:00 EDT. Este padrão está ainda em processo de formação. Possível previsão de movimento em baixa para o nível de 231.2309 no próximo 2 dias.

Read more
June 8, 2021North_American_Stocks_ptIC Markets

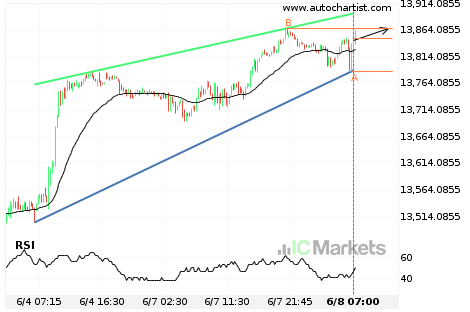
US Tech 100 Index Nível visado: 13865.8000

Cunha ascendente identificado em 08-jun-2021 07:00 EDT. Este padrão está ainda em processo de formação. Possível previsão de movimento em alta para o nível de 13865.8000 no próximo 15 horas.

Read more
June 7, 2021North_American_Stocks_ptIC Markets

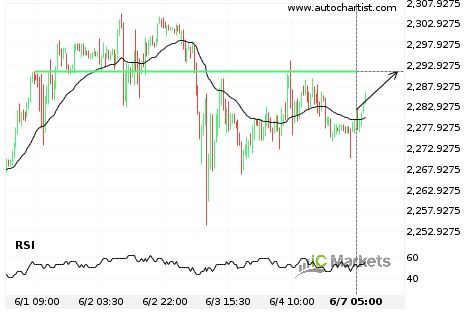
US Small Cap 2000 Index Nível visado: 2291.4800

Aproximando-Resistência nível de 2291.4800 identificado em 07-jun-2021 05:00 EDT

Read more
June 4, 2021North_American_Stocks_ptIC Markets

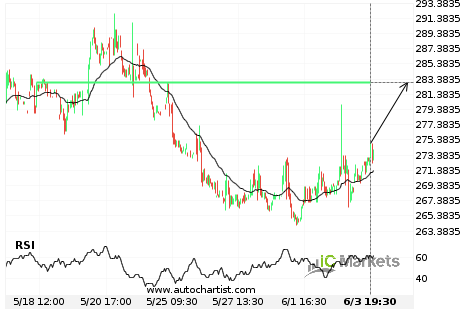
Biogen Idec Inc Nível visado: 282.9700

Aproximando-Resistência nível de 282.9700 identificado em 03-jun-2021 19:30 EDT

Read more
June 3, 2021North_American_Stocks_ptIC Markets

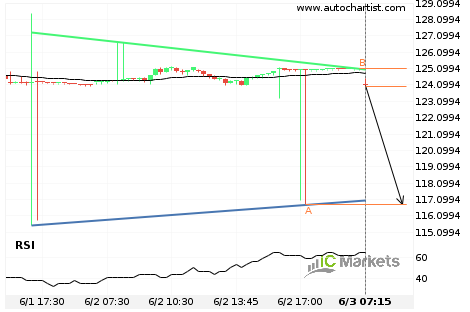
Apple Inc. Nível visado: 116.7944

Triângulo identificado em 03-jun-2021 07:15 EDT. Este padrão está ainda em processo de formação. Possível previsão de movimento em baixa para o nível de 116.7944 no próximo 17 horas.

Read more
June 2, 2021North_American_Stocks_ptIC Markets

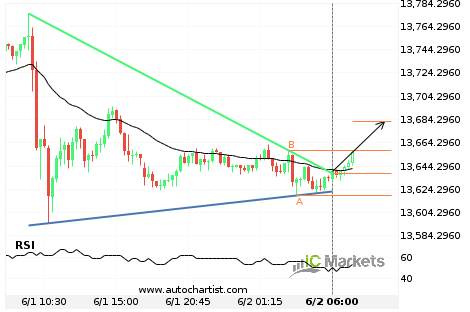
US Tech 100 Index Nível visado: 13682.5393

Triângulo quebrou na linha de resistência em 02-jun-2021 06:00 EDT. Possível previsão de movimento em alta nos próximos 6 horas para 13682.5393

Read more
June 1, 2021North_American_Stocks_ptIC Markets

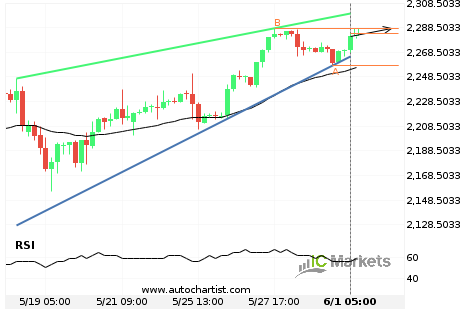
US Small Cap 2000 Index Nível visado: 2287.8700

Cunha ascendente identificado em 01-jun-2021 05:00 EDT. Este padrão está ainda em processo de formação. Possível previsão de movimento em alta para o nível de 2287.8700 no próximo 3 dias.

Read more
May 31, 2021North_American_Stocks_ptIC Markets

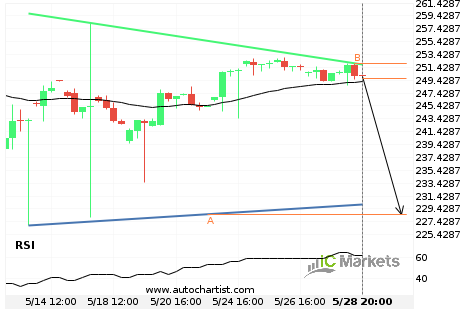
Microsoft Corporation Nível visado: 228.6362

Triângulo identificado em 28-mai-2021 20:00 EDT. Este padrão está ainda em processo de formação. Possível previsão de movimento em baixa para o nível de 228.6362 no próximo 2 dias.

Read more
May 28, 2021North_American_Stocks_ptIC Markets

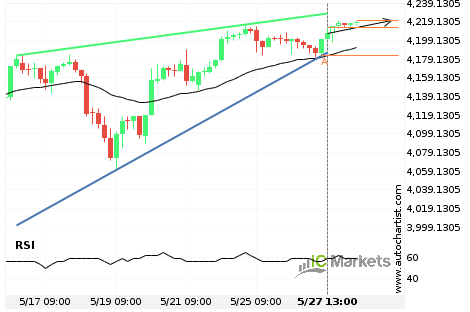
US SPX 500 Index Nível visado: 4216.1000

Cunha ascendente identificado em 27-mai-2021 13:00 EDT. Este padrão está ainda em processo de formação. Possível previsão de movimento em alta para o nível de 4216.1000 no próximo 2 dias.

Read more
May 27, 2021North_American_Stocks_ptIC Markets

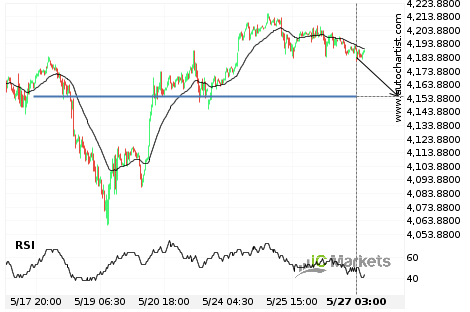
US SPX 500 Index Nível visado: 4155.1001

Aproximando-Apoiar nível de 4155.1001 identificado em 27-mai-2021 03:00 EDT

Read more
  • 1
  • 2
  • 3
  • …
  • 79
  • 80
  • 81
  • 82
  • 83
  • 84
  • 85
  • …
  • 87
  • 88
  • 89

Recent Posts

  • Either a rebound or a breakout imminent on SILVER
  • GOLD Nível visado: 2976.3601
  • A potential bearish movement on GOLD
  • มีโอกาสเกิดการเคลื่อนตัวแบบ bearish บน GOLD
  • Posible gran movimiento en el AUDJPY

Recent Comments

    Translation


     Edit Translation

    Trade with

    a market leader you can rely on

    Open Trading Account Try a Free Demo

    Forex Trading

    • Accounts Overview
    • Open an Account
    • Launch Web Trader

    Trading Specifications

    • Spreads and Commissions
    • Range of Market
    • Trading Hours
    • Funding
    • Withdrawal

    About IC Markets

    • Help Center
    • Why IC Markets
    • Regulation
    • Legal Documents
    • Contact Us


    Forex Trading

    • Accounts Overview
    • Open an Account
    • Launch Web Trader

    Trading Specifications

    • Spreads and Commissions
    • Range of Market
    • Trading Hours
    • Funding
    • Withdrawal

    About IC Markets

    • Chat with a Specialist 24/7
    • Why IC Markets
    • Regulation
    • Legal Documents
    • Contact Us

    Disclaimer: This material is marketing material where all marketing material is published for informational purposes only. This material does not contain and should not be considered as containing - investment advice and recommendations, or suggestions for performing any actions with financial instruments. The built-in widgets belong to their external independent authors, and IC Markets is not responsible for their content and their impact on trade.

    All content rights reserved. Opinions of the authors may not coincide with the opinion of the blog editors. When copying materials from this site or connecting to an RSS feed to republish our articles, a link to IC Markets or attribution in the format ‘IC Markets Blog’ is required. For general questions, please contact the editorial office via the form on the Contact us page.

    Risk Warning: Trading Derivatives carries a high level of risk to your capital and you should only trade with money you can afford to lose. Trading Derivatives may not be suitable for all investors, so please ensure that you fully understand the risks involved and seek independent advice if necessary. A Product Disclosure Statement (PDS) should be considered before entering into a transaction with us.

    The contents of this page are general information only and does not take into account your personal situation, financial objectives or needs. It is up to you to make sure the products that we offer suit your specific needs. You should not trade with us unless you understand the features and risks of the products that we offer. This means that you might need to seek independent advice before you start trading with us.

    © 2022 Raw Trading Ltd | All rights reserved.
    • Sample Page